Vidulividuli

Changelog

Track all the latest updates, improvements, and fixes to Viduli

Action notifications and other updates

v2025.04.01

This update makes it easier to follow what is happening across your resources, understand your costs, and move through the console with less friction.

What's new

Resource action notifications

Get notified as your resource actions move through the queue, run, succeed, or fail. Open Notifications from the account menu to see recent activity, then click an item to jump straight back to the affected resource.

Clearer invoices and cost breakdowns

Invoices and project costs now show more useful detail:

  • Billing-period dates are visible alongside current and past costs.
  • Project-tier charges and resource costs are broken out separately.
  • Resource costs can be expanded to review instance usage.
  • Open invoices are labelled Current for easier scanning.

When an invoice is settled, Viduli now emails the organization owner a PDF copy. If a payment fails, the owner receives an alert with the relevant invoice attached.

Improved resource setup

Creating a resource is more focused. Choose your framework or engine first, see your selection while you configure it, and avoid changing fields that are already determined by that choice.

Better instance status and uptime

Resources with instances that are still starting now show a dedicated Pending status. Once an instance is running, its displayed uptime begins from the container start time for a more accurate view.

Easier configuration and navigation

  • Long resource configuration pages now include an in-page section menu on larger screens.
  • Resource details, project tabs, and console panels scroll more predictably.
  • Reserved example domains such as example.com cannot be added to projects.

A more reliable shell

The browser shell now keeps its terminal size in sync when you connect and resize the window, fixing the rendering of command output.

Deployment and monitoring polish

  • Django apps can opt into WSGI startup with AUTO_USE_WSGI=1.
  • Deployments continue if Django static-file collection fails, so optional static assets do not block a build.
  • Deployment logs now more clearly distinguish successful, informational, warning, and error messages.
  • Monitoring charts and resource controls have received readability improvements.

Jump from instances to metrics, logs, and shell

v2025.04.01

When something looks off on one instance, you shouldn't have to dig through filters to get there.

What's new

Shortcuts on every instance

The Instances table now includes quick links for Metrics, Logs, and Shell on each row. Click through and you'll land on that view with the instance already selected.

Shell is available when the instance can accept a session. Failed, succeeded, and terminating instances keep Metrics and Logs, with Shell disabled.

Instance filter that sticks

Metrics, Logs, and Shell keep the selected instance in the URL. Share a link or refresh the page and you'll reopen the same instance.

Open any resource, go to Instances, and use the shortcuts on a row to try it out.

Updated default runtimes across Ignite

v2025.04.01

Ignite build images pick up newer default runtimes so new deploys land on current language releases.

What's new

Default versions

These are the new defaults for framework builds (rebuild to pick them up):

LanguagePrevious defaultNew default
.NET / ASP.NET Core9.010.0
Go1.25.51.26.5
Node.js24.12.024.19.0
PHP8.28.5
Python3.14.23.14.7
Ruby3.4.43.4.10
Rust1.92.01.97.1

Static Node builds that ship with Nginx also move from Nginx 1.29.4 to 1.31.3.

Ruby version files

Ruby projects can set the version with a bare number (3.4.10) or an rbenv/asdf-style value (ruby-3.4.10) in .ruby-version.

Docs

Framework support pages list the current images and ports for each stack. See Framework support for details per language.

Monitoring is now Metrics

v2025.04.01

Resource performance views got a clearer name and a stronger foundation.

What's new

Monitoring → Metrics

The Monitoring tab on resource details is now Metrics. Same place in the console - clearer label for what you're looking at.

Prometheus-backed charts

Metrics are now pulled from Prometheus. That means fresher time-series data and resource-specific signals beyond basic CPU and memory - requests and latency for apps, connection and transaction rates for Postgres, hit rates for Redis, and broker throughput for Kafka.

Open any resource, switch to the Metrics tab, and pick a time range to explore. For the full list of signals per resource type, see the Metrics docs.

Kafka is here with Surge

v2025.04.01

Event-driven systems deserve infrastructure that keeps up. Today we're launching Surge, our managed messaging service, with Apache Kafka as the first engine.

What's new

Managed Kafka clusters

You can now create Apache Kafka resources directly from your project. Choose a cluster layout, size your nodes, set topic defaults, and Viduli handles provisioning, lifecycle, and the day-to-day cluster surface - so you spend less time on brokers and more time on the events that move your product.

Surge runs on Kafka 4+ with KRaft, so you get modern Kafka without ZooKeeper overhead.

Flexible node layouts

Start simple or go production-oriented:

  • Combined nodes - Controllers and brokers on the same pool, great for testing and lighter workloads
  • Independent pools - Separate controller and broker nodes when you need clearer scaling and production-style operation

Topic management in the console

Create, update, and delete topics from the Topics tab on your Kafka resource. Set partitions, replication, cleanup policy, and other defaults once at the cluster level, then apply them consistently as your streams grow.

Built into the Viduli workflow

Kafka sits alongside your apps, databases, and caches as a first-class resource. Start, stop, and configure clusters from the project overview and resource details view - same lifecycle patterns you already know.

How to try it

  1. Open your project overview
  2. Click New Resource and select Surge
  3. Choose Apache Kafka
  4. Pick a layout, configure topic defaults, review cost, and confirm

Provisioning starts right away. For field-level details, see the Surge docs.

Kafka clusters require a payment method, and each project can currently hold one Kafka cluster. We're excited to see what you stream next.

Project templates

v2025.04.01

Starting a new project just got a lot faster. Pick a template and Viduli sets up the full stack for you - ready to build on.

What's new

Create from a template

When you create a project, you can now choose Project Template instead of Blank Project. Pick a starter from the gallery, connect GitHub, and Viduli clones the full stack into your account - apps, database, secrets, canvas layout, and private repos - then provisions everything for you.

First launch usually takes about 5-10 minutes while resources come online.

AI Chatbot starter

Our first template is live:

  • AI Chatbot - React, FastAPI - A React frontend, FastAPI backend, and Postgres database for storing conversations

More starters are on the way. For now, this is a solid path from zero to a running chat app on Viduli.

How to try it

  1. Open Create Project from the console
  2. Choose Project Template
  3. Select the AI Chatbot template
  4. Pick a GitHub account, name your project, and create

We’ll keep adding templates so you can go from idea to running stack with less setup and more shipping.

Smarter resource actions

v2025.04.01

Resource actions are easier to read, share, and follow from start to finish.

What's new

Deploy context at a glance

Actions that ran a deploy now show the branch and commit hash used for that run. Each is linked directly to the corresponding page on GitHub and opens in a new tab, so you can jump from a deploy action to the exact code without leaving your flow.

Deep-linked action logs

Expanding an action in the Actions tab updates the URL with an action query parameter. Share the link or bookmark it to reopen the same action already expanded — handy when you're debugging with a teammate or picking up where you left off.

Notifications that go somewhere useful

Clicking an action in the notification sheet now:

  • Navigates to the resource Actions tab with that action expanded
  • Closes the sheet automatically so you're not left staring at an overlay

Clearer log retention

For actions older than 14 days, the logs panel now explains that logs are deleted after 14 days — matching how action logs are stored — so an empty log view is no longer ambiguous.


These updates apply wherever you review resource actions: the Actions tab and the notification sheet - opened by clicking the bell icon on the sidebar.

Instance-level visibility

v2025.04.01

We've added a new Instances tab to resource details, giving you real-time visibility into individual instances.

The new Instances tab shows:

  • Resource utilization – Current CPU and memory usage for each instance
  • Container status – Restart counts
  • Instance health – Pod status with color-coded indicators (Running, Pending, Degraded, Failed)
  • Uptime tracking – Age of each instance (e.g., "2d 5h", "3h 20m")

You can access the Instances tab by:

  • Double-clicking any resource node on the infrastructure canvas
  • Right-clicking a resource and selecting "Instances" from the context menu
  • Navigating to the Instances tab in the resource detail page

Note: The Instances tab is available for all resource types: Apps, Databases, Caches, and Brokers.

Exposing durable logs

v2025.04.01

Previously we were displaying ephemeral logs from running instances in the web console.

We have switched to a Loki-powered log collection system, now all logs are available for viewing even after a container terminates.

During the beta period, the log retention period is 30 days at no extra cost.

Note: We may introduce fees based on the log storage volume to ensure fair usage of the platform.

P.S. We've also increased our test coverage and fixed many bugs in the process.

A Whirlwind of Shipping

v2025.04.01

Since our last update, we have made significant improvements to the platform.

We have:

  • Introduced project tiers
    • Free – Designed for development and testing, these projects provide a gateway with no performance guarantees and are subject to deletion.
    • Basic – Ideal for low-traffic applications, featuring a mix of dedicated and burstable compute resources.
    • Premium – Built for sustained high traffic with dedicated gateway compute to ensure consistent performance.
    • Premium HA – Our most resilient tier, offering dedicated gateway instances distributed across three Availability Zones.
  • Automated underlying K8s cluster scaling – The infrastructure now scales dynamically to meet any level of demand without manual intervention.
  • Implemented Prometheus-based metrics collection – We have transitioned from basic CPU and memory tracking to detailed metrics, including RPS, disk I/O, bandwidth, and transactions per second.
  • Switched to Loki-based log collection – We have replaced ephemeral instance logs with a centralized system that retains all logs for at least 30 days.
  • Increased system test coverage – This allows us to ship updates faster while having already identified and patched several subtle performance bugs.
  • Overhauled build system – We have significantly improved our build success rates to ensure faster and more reliable deployments.
  • Improved the UX of the Web console
    • Added context menus to resources directly on the canvas for quicker navigation.
    • Integrated context menus for organizations, teams, and projects throughout the entire console.
    • Used lazy loading to improve page load times – By loading components only when needed, we’ve significantly reduced initial wait times across the dashboard.
  • Bug fixes and stability improvements
    • Resolved "jank" and layout shifts on the home, sign-in, and sign-up pages.
    • Fixed a bug where the "apply changes" toast notification failed to appear on the configuration page.
    • Patched an issue that prevented new accounts from successfully deploying free-tier Ignite apps.
    • Resolved underlying issues with the email verification workflow.

Note: While the backend infrastructure is live, the new metrics and logging updates are currently being integrated and will be reflected in the web console shortly.

Background
Team Collaboration is Here

Team Collaboration is Here

v2025.04.01

We're excited to announce team collaboration features that make it easier than ever to work together on our cloud infrastructure.

What's New

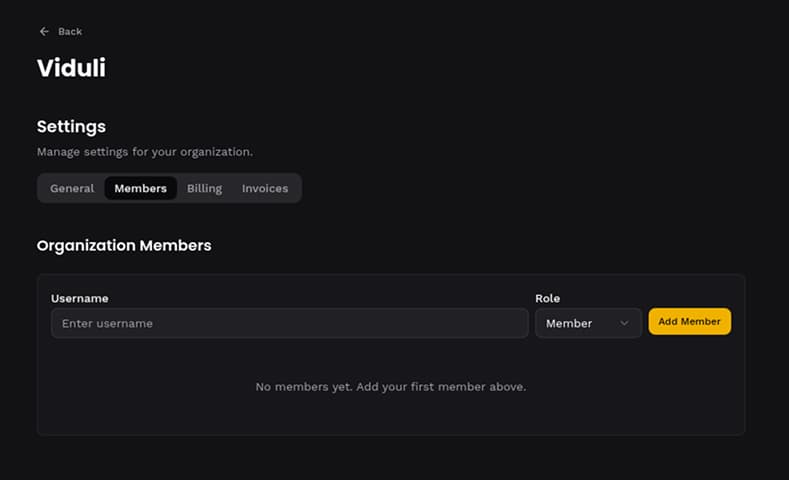
Organization Members

Invite your teammates to join your organization with role-based access control:

  • Organization Managers – Administrative access to manage members, teams, and projects
  • Organization Members – Collaborate on projects in the team they're assigned to

Team-Based Access

Organize your projects and resources with flexible team structures:

  • Team Leads – Manage team membership, resources, and project configurations
  • Team Members – Collaborate on deployments, databases, and other resources within their teams

Why This Matters

Whether you're a startup scaling your engineering team or an agency managing multiple client projects, these collaboration features give you the control and flexibility to work the way your team needs.

Start inviting your team today and build together!

Background
Console Navigation Improvements

Console Navigation Improvements

v2025.04.01

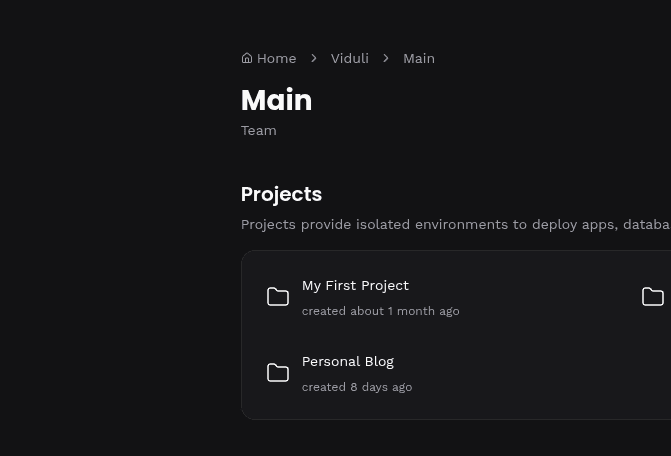
We've improved console navigation by adding breadcrumbs to the console pages.

You can now easily get an idea of your current location in the console

And you can navigate to the home page, organization, and team pages by clicking the breadcrumbs.

Background
Credit card trust signals

Credit card trust signals

v2025.04.01

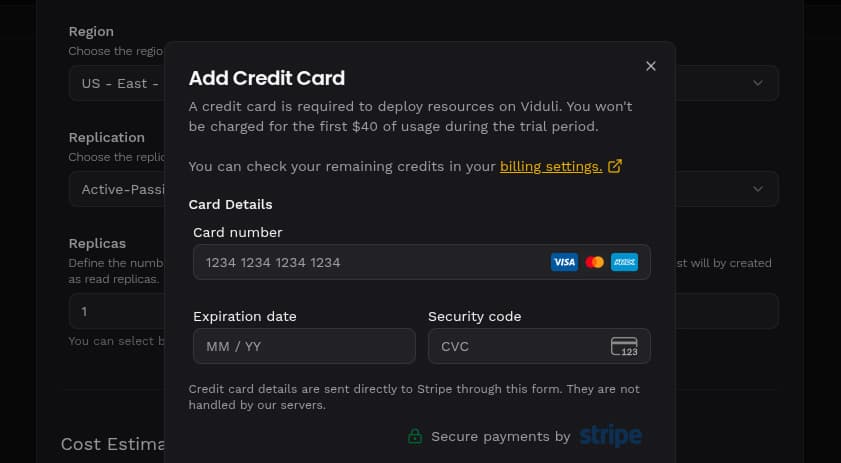
We've added trust signals to the credit card form to reassure users that their data is secure.

Credit cards are processed directly by Stripe, our PCI-compliant payment processor.

We do not handle any credit card data on our servers.

Our application code does not have access to any credit card data. It's directly entered into stripe checkout form.

Yes, that's a stripe checkout form, it's just in our brand colors.

Background
Platform Monitoring

Platform Monitoring

v2025.04.01

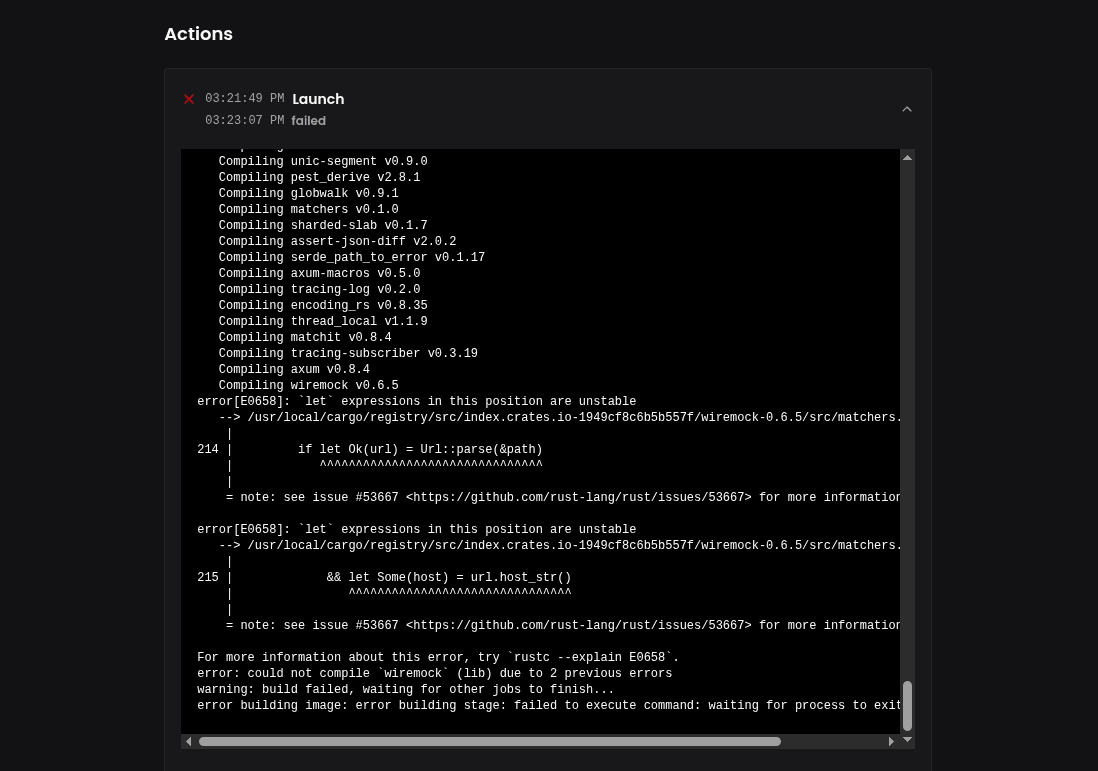
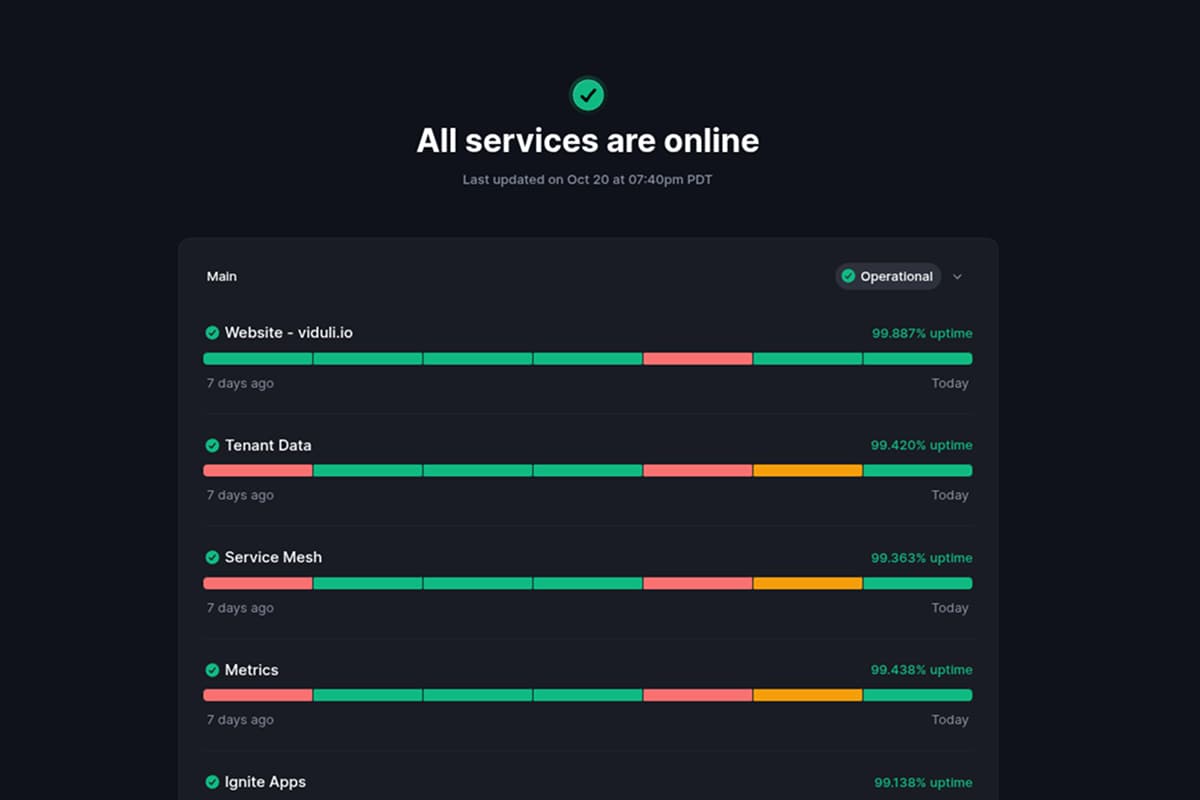
Earlier this month, we quickly put together health check code to get our platform monitoring live in production. While it worked, it had some significant shortcomings. The code was originally designed to run in a worker pool but was repurposed to run on the main thread, and it didn't support concurrency. Needless to say, that didn't go well. It blocked all subsequent requests to the server and triggered Kubernetes to restart the pod.

We've now rewritten our health check system to be fully async and run in thread pools. Our health checks fully emulate the actions a user would take on the platform, providing the best possible assurances to our end users. We also fixed a critical issue where hard-coded resource IDs were causing concurrency conflicts - resource IDs are now generated dynamically. The result? Our health checks now support n-level concurrency instead of being limited to a single instance.

But, the platform monitoring saga is not over yet. Our Ignite Apps deployment check intermittently fails. We are investigating now. Stay tuned for more updates!

We've improved empty state messages throughout the console to make it clearer what to do when you're just getting started with a new team or project.

What's Improved

When you first access a team without projects or view a project without resources, you'll now see:

  • Clearer messaging – Descriptive titles and explanations that tell you exactly what's missing
  • Quick actions – Prominent buttons to create your first project or launch your first resource
  • Documentation links – Direct access to relevant guides when you need more context

These updates make onboarding smoother and help you get started faster, with less confusion about your next steps.

Background
Welcome to Viduli Changelog

Welcome to Viduli Changelog

v2025.04.01

We're thrilled to announce the launch of our brand new website! This marks an exciting milestone in our journey to democratize enterprise-grade cloud infrastructure for developers everywhere.

What's New

Our newly redesigned platform is packed with comprehensive content to help you understand Viduli and get started:

Core Pages

  • Landing Page – A fresh, modern introduction showcasing our mission to make cloud deployment as easy as localhost
  • Blog – Stay updated with insights, tutorials, and product announcements from our team
  • Changelog – Keep track of all improvements and new features we're shipping (you're reading it right now!)

Product Pages

We've launched dedicated pages for each of our core services:

  • Ignite – Our application deployment service that supports 30+ frameworks with zero configuration
  • Orbit – Managed database service with automatic backups and high availability
  • Flash – High-performance Redis caching without the operational burden

Each product page includes detailed feature breakdowns, technical specifications, use cases, and comparison charts to help you make informed decisions.

Company Pages

  • Pricing – Transparent, usage-based rates with zero hidden fees. See exactly what you'll pay for CPU, RAM, disk, and network resources
  • About – Learn about our mission, founding story, and the values that drive every decision we make
  • Careers – Join our remote-first, engineering-led team building the developer platform we all wish existed

What's Next

This comprehensive launch is just the beginning. We're committed to continuously improving the platform, shipping new features, and expanding our documentation based on your feedback.

Welcome aboard, and thank you for being part of our community!