
Serving 200 million requests per month for 60 dollars
We explore how Viduli can serve 200 million requests per month for just 60 dollars in spend using a non-trivial backend application.

We built Viduli to serve high traffic websites at minimal cost, and we wanted to prove that we had actually accomplished it rather than just claim it on a pricing page, so we ran a benchmark that simulated a real application instead of a synthetic one. In this article we explore how we tuned a Django backend to serve over 200 million requests per month for just $60 on Viduli.
The application
We didn't want to benchmark with a toy app that returns hello world, because anyone can make hello world fast and it tells you nothing about what a real service costs to run. So we picked a common scenario encountered on social networks - content creators making posts and viewers commenting on them - and built a non-trivial API around it.
We chose Django, our favorite framework, for the API. It's our favorite because Python is fast to build with, and Django is batteries included - auth, tokens, db models, api responses and docs can be set up with very few lines of code. Python is not known for being a fast language, but it's excellent for development velocity, which is why it's chosen by a lot of startups, and Django web apps serve billions of users daily at multi-billion dollar companies. For the database we chose Postgres, a time tested ACID-compliant database that serves 2 billion users at Instagram.
The app is a set of CRUD REST APIs for posts and comments, plus a login view and a route to fetch the user's own details. We deliberately skipped user registration endpoints for this scenario and seeded the data with a Django management command instead, because signup flows would have added noise to the workload without making the benchmark any more realistic.
When coding the application we followed production coding patterns, and we didn't skip on any dependencies just to reduce code execution volume and inflate benchmark results. We used our years of expertise to make sensible optimizations from the start:
- When fetching the post and comment models we load the author with it using
select_relatedto avoid n+1 queries. - The post model has a composite index to filter by author and sort by created date, because that's the common access pattern.
- The comment model has two composite indexes - one to filter by author and sort by created date, and one to filter by post and sort by created date.
It's worth noting that the index choices were made on presumption and may have downsides such as bloat at scale, so treat them as sensible defaults rather than gospel.
We used DRF to set up the APIs. Subclassing ModelViewSet gives you a REST CRUD
API with only 5-10 additional lines of code needed. That is to configure the
datasource (queryset), data ordering and serialization, and we used the
django-filters library to wire up filtering automatically without any manual
logic. Auth is handled by Knox tokens, so every request in the benchmark is
authenticated - there is no unauthenticated fast path anywhere in the app.
class PostViewSet(ModelViewSet):
    """Viewset for Post CRUD operations."""

    queryset = Post.objects.select_related("author").all()
    serializer_class = PostSerializer
    filterset_class = PostFilter
    ordering_fields = ["created_at", "updated_at", "title"]
    ordering = ["-created_at"]

    def perform_create(self, serializer):
        serializer.save(author=self.request.user)
Seeding realistic data
For the test data we got a little fancy with how we seed the database, because the naive method would have produced something unrealistically uniform. A hundred users, 100,000 posts and 500,000 comments distributed evenly would mean 1,000 posts per user and 5 comments per post, but a real site has the majority of its content concentrated among a minority of active users, with comments clumped onto the popular posts.
So we used power law distributions to weight the content towards popular users and popular posts. A power law distribution is basically a curve that's very top heavy with a long tail - a small number of items get most of the traffic while the rest get a trickle.
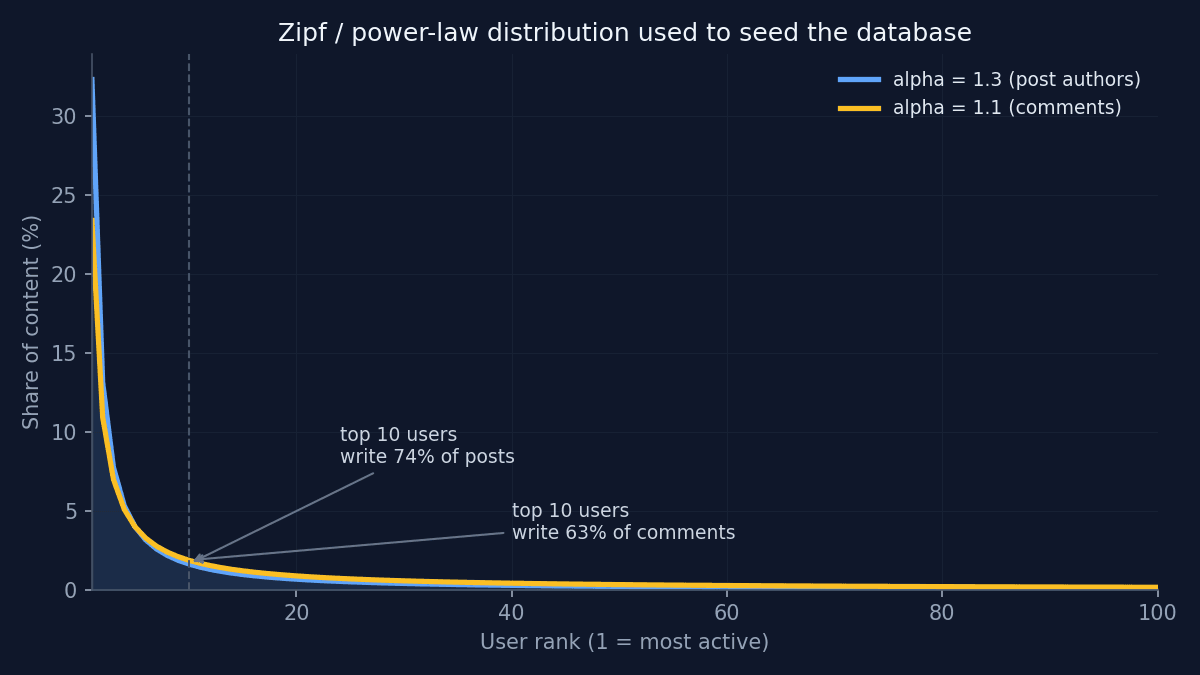
Concretely, we sample from a Zipf distribution, which is the discrete form of a power law, using nothing but the standard library:
def zipf_weights(n: int, alpha: float = 1.2) -> list[float]:
    """Return normalized Zipf weights for a power-law distribution over n items."""
    raw = [1.0 / ((i + 1) ** alpha) for i in range(n)]
    total = sum(raw)
    return [w / total for w in raw]
The alpha parameter controls how top heavy the distribution is - a higher
alpha concentrates more weight on the highest ranked items. For post authors we
use alpha 1.3 over the 100 users, so a handful of power users end up writing
most of the posts, and for comments we use alpha 1.1 over the post ids, so
comments pile onto popular posts while still reaching the long tail.
A couple of other details worth mentioning because they make reruns easy and the data more believable:
- The whole seed is deterministic - it runs off a fixed RNG seed of 42, so anyone can reproduce the exact same dataset.
created_attimestamps are spread uniformly across 365 days, so feeds and ordering queries page through a year of history rather than a single burst.- Rows are inserted in batches of 5,000 with
bulk_create, and the command is idempotent - rerunning it only inserts rows up to the target counts.
The goal with 100 users, 100,000 posts and 500,000 comments was to have a non-trivial dataset, not to stress the limits of Postgres' ability to serve queries.
The workload
For the benchmark too, we attempted to simulate a real workload rather than a
flattering one. We didn't just hammer one endpoint like the list /posts route
over and over; instead we divided the workload into roughly 70% reads and 30%
writes, spread across every endpoint in the app. The full weights are as
follows:
Read endpoints
GET /posts- list posts - 20%GET /posts/:id- get post details - 15%GET /posts/:id/comments- list comments - 15%GET /posts/:id/comments/:comment_id- retrieve a comment - 10%GET /posts?author- list posts filtered by author - 5%GET /me- get own profile - 5%
Write endpoints
POST /posts- create a post - 10%POST /posts/:id/comments- create a comment - 10%PATCH /posts/:id- update a post - 5%PATCH /posts/:id/comments/:comment_id- update a comment - 5%
We also made the traffic patterns within each endpoint realistic. For the list endpoint we retrieve the first page 50% of the time, because most real users never scroll past the top of a feed, and for 30% of requests we pick a page between 2 and 10, and the remaining 20% of the time we pick a page between 11 and 40, which forces Postgres to actually walk the indexes rather than always serving the same cached first page. Object ids come from prior list and create responses instead of being random, so the benchmark never measures a cascade of cheap 404s. About 30% of detail traffic prefers "hot" recent posts the way real users cluster around fresh content.
Each virtual user is assigned one of the 100 seeded accounts, logs in once to exchange credentials for a token, and then reuses that token for every subsequent request, which is exactly how a real client behaves. We used the same password for all accounts to simplify the benchmark script.
We used the Python Locust framework for the load test. It's a great framework for this because it lets us implement advanced scenarios like the above with ease - it's a declarative framework that uses classes and decorators to define user-based, diverse api workloads. The whole thing is open source, so if you want to pick apart the exact implementation you can find the app and the benchmark suite at github.com/viduli-io/django-bench.
Running the benchmark
We ran Locust from a separate machine pointed at the app's public URL over HTTPS, so the measured latencies include the full cost of TLS and an internet round trip, the same as any real user would experience:
export BENCHMARK_PASSWORD=benchmark-pass-123
export BENCHMARK_USERS=100
export RPS_CAP=100

uv run locust -f locustfile.py --headless \
  --host https://django-bench.viduli.app \
  --users $BENCHMARK_USERS \
  --spawn-rate 0.25 \
  --run-time 1hr
Tuning the deployment
We ran the benchmark, we didn't like the numbers we got so we made a couple of changes. Together they took sustained throughput from roughly 60 to 80 requests per second on identical hardware.
WSGI over ASGI
Viduli's Django entrypoint prefers ASGI serving when a asgi compatible server such as uvicorn is installed. We first tried with uvicorn, but every view in the app is a synchronous DRF view, which means ASGI brought us no gains because every single request went through the async-to-sync adapter and synchronized to the main thread prior to executing.
So we set AUTO_USE_WSGI=1, which tells the entrypoint to skip the ASGI path
entirely and run plain gunicorn sync workers instead, deriving the worker and
thread counts from the container's CPU allocation. The auto-start script
executes something like this,
gunicorn --bind 0.0.0.0:$PORT --workers $WORKERS --threads $THREADS backend.wsgi:applicationWorkers are auto-sized by the entrypoint at 2 × cores + 1, with 2 threads per
worker. That's 3 workers with 2 threads each, or 6 requests being handled
concurrently at any moment.
As you will see later in the results, the test bottlenecked on DB CPU before all Django CPU was consumed, so we didn't bother optimizing workers any further.
Connection pooling
The second change was turning on connection pooling, and the nice part is that it's Django 6.1's native psycopg3 pooling configured through the database settings - no PgBouncer sidecar and no third-party library. The pool is toggled and sized entirely through environment variables:
if os.environ.get("DB_POOL", "0") == "1":
    _db_options["pool"] = {
        "min_size": int(os.environ.get("DB_POOL_MIN_SIZE", "4")),
        "max_size": int(os.environ.get("DB_POOL_MAX_SIZE", "16")),
        "timeout": float(os.environ.get("DB_POOL_TIMEOUT", "30")),
    }
We limited each pool to a minimum of 2 and a maximum of 4 connections, and since
each gunicorn worker process holds its own pool, the 3 workers keep between 6
and 12 Postgres connections open at any time - a deliberate bound so that
scaling the app out can never quietly run away from the database's
max_connections. One detail worth knowing is that CONN_MAX_AGE is set to 0
when pooling is on, because the pool owns connection persistence.
With both changes in place, sustained throughput moved from around 60 to 80 requests per second - a third more traffic from the same resources.
The results below were produced with this environment:
AUTO_USE_WSGI=1
DB_POOL=1
DB_POOL_MIN_SIZE=2
DB_POOL_MAX_SIZE=4
Results
Type     Name                                                         # reqs      # fails |    Avg     Min     Max    Med |   req/s  failures/s
--------|-----------------------------------------------------------|-------|-------------|-------|-------|-------|-------|--------|-----------
GET      GET /api/v1/me                                                  495     0(0.00%) |    375     288    1901    310 |    4.50        0.00
GET      GET /api/v1/posts                                              2244     0(0.00%) |    437     301    2208    370 |   16.50        0.00
GET      GET /api/v1/posts/:id                                          1488     0(0.00%) |    391     290    2094    320 |   10.70        0.00
GET      GET /api/v1/posts/:id/comments                                 1554     0(0.00%) |    390     289    1846    320 |   13.10        0.00
GET      GET /api/v1/posts/:id/comments/:id                              988     0(0.00%) |    394     291    2124    320 |    8.90        0.00
GET      GET /api/v1/posts?author                                        495     0(0.00%) |    415     296    1339    340 |    4.00        0.00
PATCH    PATCH /api/v1/posts/:id                                         504     0(0.00%) |    382     293    1449    320 |    4.10        0.00
PATCH    PATCH /api/v1/posts/:id/comments/:id                            472     0(0.00%) |    397     293    2167    330 |    3.90        0.00
POST     POST /api/v1/auth/login                                          48     0(0.00%) |   1349     911    2291   1300 |    0.30        0.00
POST     POST /api/v1/posts                                             1013     0(0.00%) |    388     288    1931    320 |    8.10        0.00
POST     POST /api/v1/posts/:id/comments                                 952     0(0.00%) |    392     290    1291    330 |    6.80        0.00
--------|-----------------------------------------------------------|-------|-------------|-------|-------|-------|-------|--------|-----------
         Aggregated                                                    10253     0(0.00%) |    406     288    2291    330 |   80.90        0.00
The headline number is 80.9 requests per second aggregated, with a 0.00% failure rate on every single endpoint - no 500s, no timeouts, no connection errors, even on the write endpoints. Median latency was 330ms end to end over the internet, and since the fastest request in the entire run still took 288ms, a good chunk of that is pure network and TLS overhead rather than application time.
The one outlier is the login endpoint at ~1.3 seconds, and that's expected rather than a problem - Knox verifies passwords with PBKDF2, which is deliberately expensive, and each virtual user only logs in once at the start and then rides its token, which is why login is barely 0.3 req/s of the overall traffic.
While the benchmark ran we also watched resource usage on the cluster:
NAME                               CPU(cores)   MEMORY(bytes)
api-gateway                        91m          65Mi
benchmark-api (Django)             610m         281Mi
pgdb-instance-set (Postgres)       1020m        882Mi
So the entire system - the Django app, the project gateway in front of it, and the Postgres instance behind it - is doing 80+ req/s on roughly one vCPU worth of application compute, roughly one vCPU worth of database compute, and under a gigabyte of memory each.
Monitoring
Viduli lets you monitor applications in great detail at no additional cost, so while the benchmark ran we camped out in the metrics view and watched the performance profile of each service take shape under load.
On the Django instance, CPU usage spiked to around 0.8 vCPU before settling back to a steady 0.6, and frankly that surprised us, because we expected utilization to climb to a plateau and stay there rather than spike and settle. Requests per second climbed steadily until they maxed out at 80, and memory was a flat 220MB from start to finish, which is about as uneventful as memory gets.
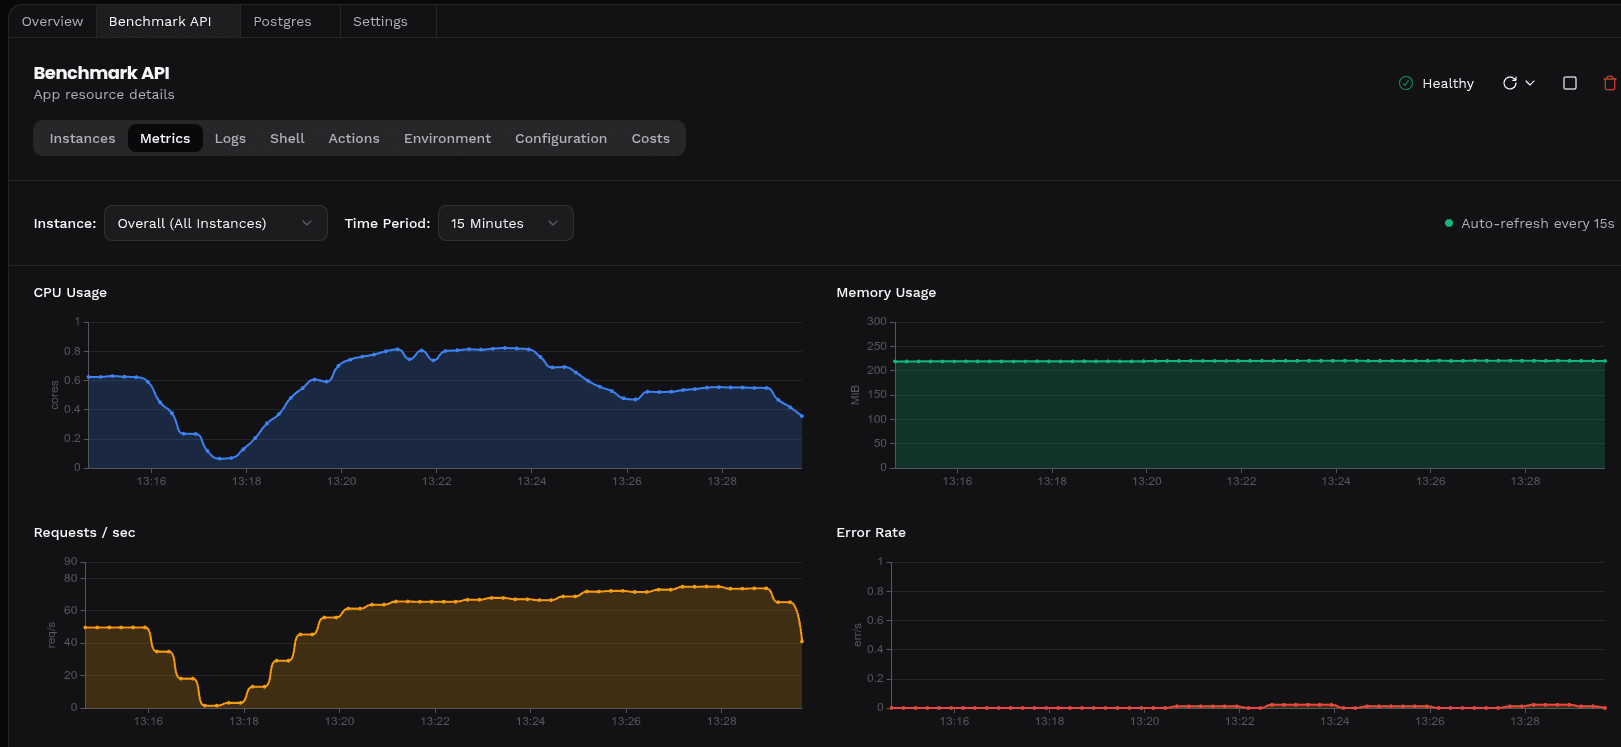
The Postgres instance behaved more like we expected, with load climbing gradually until it settled at a steady 100% utilization of the single allocated core. The cache hit ratio sat at 100%, which tells you the entire dataset was living in memory - around 700MB of RAM resident for a database that's only about 220MB on disk. Active connections into Postgres averaged 10 out of the 100 allowed, with intermittent rises to 14 and a peak of 16, which lands right where the pool math from the tuning section predicted - the 6 to 12 connections the worker pools keep open, plus a few extras from Viduli internals.
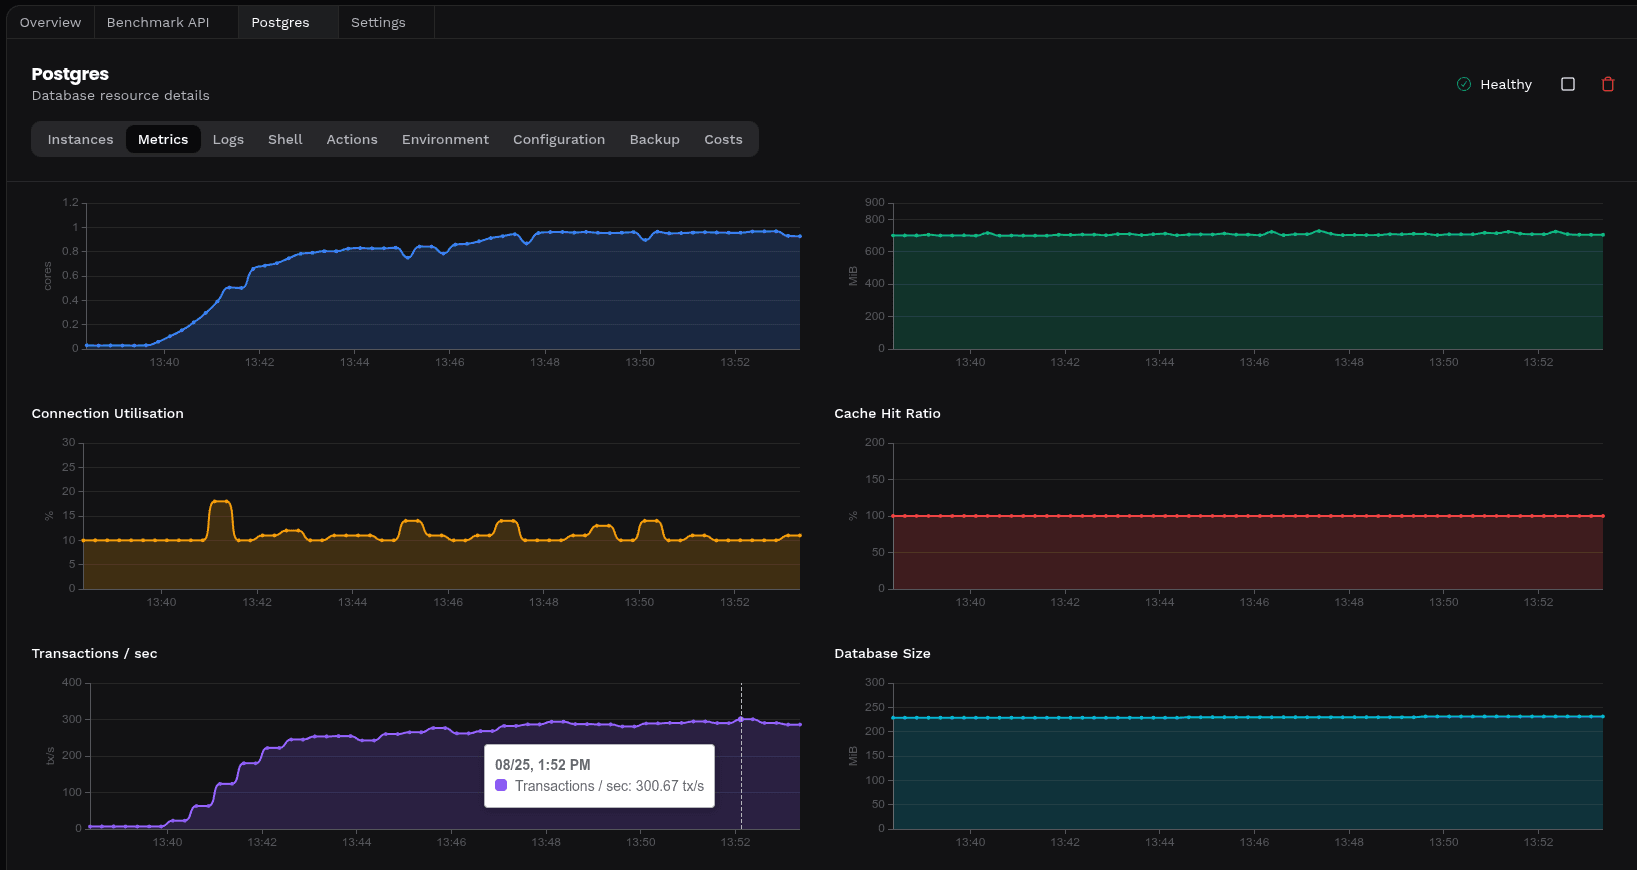
The most interesting statistic of the whole run was transactions per second, which rose steadily from idle and peaked at a whopping 300 - or, on average, a bit less than 4 transactions per request at 80 req/s. So where do all those transactions come from, when the endpoints themselves only need one or two queries each? Django doesn't wrap requests in atomic transactions by default, so every SQL statement runs as its own implicit transaction, which means the TPS counter is really a statement counter. Digging in to the internals, we found that:
- Knox runs two lookups on every authenticated request - the obvious one that finds the token with its user joined in, and a less obvious one where it fetches every token the user has ever issued to check for expired ones.
- The paginated list endpoints - posts, comments and the author filter - each run a COUNT for pagination alongside the actual page query, so two statements where you might expect one.
- The detail endpoints run a single SELECT because
select_relatedfolds the author in, creates are a single INSERT, and the PATCH endpoints do a SELECT to fetch the object before UPDATEing it.
The takeaway is that more than half of all database traffic is authentication rather than API work - Knox alone accounts for two of every three and a half transactions - which is why Postgres ended up working harder than the app itself.
It's worth going off on a tangent on how we found all this out, because it was all just there waiting for us to analyze, with no additional work. There was no standing up Prometheus, Grafana and a forest of exporters, no agents to install and no dashboards to build - the transaction rate, the cache hit ratio and the connection counts were just there, part of the project's monitoring at no extra charge. Going from "Postgres is using more CPU than the app, that's odd" to a precise census of who's issuing what in an afternoon is a very good return on investment if you ask me. It's the kind of visibility that usually costs a week of platform engineering to stand up yourself.
All of which means there's real headroom sitting on the table - if the database is spending most of its effort checking tokens and counting rows rather than serving the actual API, then the same hardware has more to give. In a follow-up article we'll take a look at exactly that, optimizing the code - caching the token lookups, trimming the pagination counts and a few other tricks - to see how much more performance we can squeeze out of the same deployment.
Doing the math
80.9 requests per second might not sound like much, but a month is a long time. There are 2,592,000 seconds in a 30 day month, so:
80.9 req/s × 2,592,000 s ≈ 210,000,000 requests per monthOver 200 million requests a month, on deployment-sized hardware that fits in about a vCPU and a gigabyte per component.
What it costs on Viduli
Viduli bills per-second of resource usage with a one minute minimum, and the rates are simple - $16 per vCPU-month and $8 per GB-month for app instances, $20 per vCPU-month and $10 per GB-month for Postgres, plus a flat $5/month project fee that covers the gateway, load balancing, autoscaling, monitoring and the service mesh. Sizing the deployment from what we actually observed during the run:
| Resource | Size | Rate | Monthly cost |
|---|---|---|---|
| Django app (Ignite) | 1 vCPU + 1 GB | $16/vCPU + $8/GB | $24 |
| Postgres (Orbit) | 1 vCPU + 1 GB | $20/vCPU + $10/GB | $30 |
| Project - Basic Tier | - | flat | $5 |
| Total | $59/month |
That's $59 a month to serve 210 million requests, or about $0.28 per million requests, and note that the gateway pod serving every one of those requests is included in the $5 project fee - it isn't a separate line item.
The same traffic on AWS Lambda
Since serverless is the usual answer to "cheap traffic at scale", let's price the same workload on Lambda with API Gateway in front of it. We'll state our assumptions plainly so you can rerun the numbers yourself:
- 210 million requests per month
- 100ms average execution time
- 1 GB of memory allocated
- x86 on-demand pricing at $0.0000166667 per GB-second
- REST API Gateway at $3.50 per million requests
- a dedicated RDS Postgres instance for the database, since Viduli's $59 includes Postgres and the Lambda stack needs one too
The compute works out to:
210M requests × 0.1s = 21M GB-seconds
21M × $0.0000166667 ≈ $350/month in Lambda compute
And the requests themselves cost:
210M requests × $3.50 per million ≈ $735/month in API Gateway feesAnd the Lambda functions still need a database to talk to, so the stack needs a dedicated RDS Postgres instance as well. The burstable micro classes are the cheapest on paper, but our Postgres was burning a sustained ~1 vCPU of CPU throughout the run, which would exhaust a t4g instance's CPU credits in hours, so the honest option is a non-burstable class - a db.m7g.large (2 vCPU, 8 GB) at $0.168/hour:
db.m7g.large: $0.168 × 730 hours ≈ $123/month
20 GB gp3 storage (the minimum) ≈ $2.30/month
RDS total ≈ $125/month
So the total is roughly $1,210 a month - $350 of compute, $735 just for the privilege of API Gateway standing in front of the function, and $125 for a database sized to actually sustain the load - which is about 20x what the same traffic costs on Viduli.
If it were Vercel + Neon
The other stack people reach for when they don't want to manage servers is Vercel with Neon's serverless Postgres behind it. Vercel is known for Next.js, but it runs Python functions too, so our Django app deploys there unmodified - which makes this the fairest comparison of the three: same app, same data, same workload, only the hosting changes. Assumptions, stated plainly so you can rerun them:
- 210 million requests per month, every one an authenticated API hit - nothing cacheable, so every request bills a function invocation and an edge request
- 7.5ms of active CPU per request, derived from the ~0.6 vCPU our Django container sustained at 80.9 req/s
- a 2 GB function instance provisioned around the clock - Vercel ties CPU to memory at roughly 1 vCPU per 2 GB
- Neon's Scale plan at $0.222 per compute-hour - the tier that's on feature parity with Viduli - with the database averaging 1 CU, the ~1 vCPU our Postgres actually burned, every hour of the month
We look at the per-request fees first:
Edge requests: (210M - 10M included) × $2 per million ≈ $400/month
Invocations: 210M × $0.60 per million ≈ $126/month
Then the compute. Vercel's fluid billing only counts CPU while code is actively executing, not time spent waiting on the database. Nevertheless, it still adds up to quite a bit:
Active CPU: 210M requests × 7.5ms = 438 hours × $0.128 ≈ $56/month
Provisioned memory: 2 GB × 730 GB-hours × $0.0106 ≈ $15/month
And Neon's scale-to-zero never fires, because a database serving 80 req/s never goes five minutes without a query:
730 CU-hours × $0.222 ≈ $162/month
Storage: 220 MB of data, well inside the 50 GB allowance ≈ $0
So with the $20/pro subscription the total is roughly $780 a month - about 13x what the same traffic costs on Viduli, though lower than Lambda's $1,210. Two details stand out: the Neon database alone costs nearly 3x Viduli's entire stack at $162 versus $59, and the per-request fees together are nearly 9x Viduli's whole bill.
Limitations
We want to be upfront about what this benchmark does and doesn't show:
- The dataset is quite small - 100,000 posts and 500,000 comments - and a larger dataset would change the cost of the queries themselves, though any portion that stays resident in memory would matter less.
- A real application would have much more than 100 users by the time it needs to handle 80 req/s, and real user populations change the cache hit rates and index behavior.
- It doesn't simulate traffic spikes or the variable loads applications experience over days, weeks and seasons.
- CPU load based scaling may not work for all applications.
- Viduli currently has no capability to respond to large spikes in traffic within a few seconds; it scales up gradually in response to sustained load (10s).
Conclusion
We set out to prove that Viduli can serve high traffic websites at minimal cost, and a non-trivial Django app doing 200+ million requests a month for $59 - about 13x-20x cheaper than the serverless alternatives - is a pretty conclusive answer. None of this required exotic engineering either; it's a batteries-included Django app written the way any competent team would write it, running on deployment-sized resources and billed by the second.
There's still headroom on the table - in a follow-up article we'll optimize the code to see how much further the same deployment can be pushed.
If you want to run the benchmark yourself, or just poke around the app, it's all at github.com/viduli-io/django-bench.
About Viduli
If you're an engineer who'd rather spend the week shipping features than babysitting infrastructure, Viduli was built for you - one platform that replaces the three dozen tools standing between your code and your users. We're onboarding engineers as fast as we can, so request access at viduli.io/request-access and tell us what you want to build.
Cheers!
- Avin, Founder
P.S. Subscribe below for more updates.