
Real-time logs without the complexity
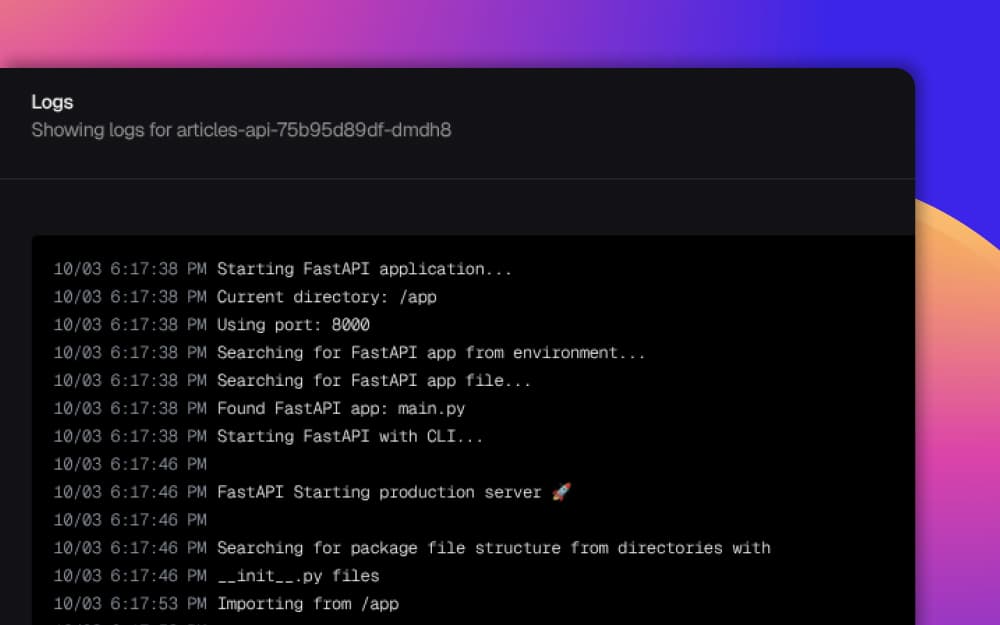
Stream logs from your entire application fleet through a unified interface. No ELK stack to maintain, no log aggregation tools to configure. Just instant access to every log line with powerful search and filtering.
Get logs instantly, without the overhead
Traditional logging requires setting up Elasticsearch, Logstash, Kibana, configuring log shippers, and managing storage. Viduli gives you production-ready logging out of the box.
ELK stack maintenance
Log shipper configuration
Scattered log locations
From code to insights in real-time
Logging happens automatically. Write to stdout/stderr and we handle the rest.
Write logs in your code
Use your language's standard logging. Print to stdout or stderr. No special libraries or configuration needed.
Automatic collection
Logs are automatically collected from all instances in real-time. No log shippers to configure or maintain.
Search and debug
Access logs instantly through our interface. Search, filter by time, instance, or log level. Debug production issues in real-time.
Production-grade logging without the infrastructure
Get enterprise logging capabilities without deploying or maintaining Elasticsearch, Logstash, Kibana, or any log aggregation stack.
Real-time streaming
See logs as they happen. No delays, no batching. Stream logs from all instances simultaneously.
Unified fleet view
View logs from all instances in one interface. No need to SSH into individual containers or pods.
Powerful search & filtering
Full-text search across all logs. Filter by time range, instance, log level, or custom queries.
30-day retention
Logs automatically retained for 30 days. Extended retention available for compliance needs.
Multiple log levels
Automatically parse and categorize INFO, WARN, ERROR, DEBUG levels. Filter by severity instantly.
Export & share
Export log snippets for bug reports. Share specific log views with your team or support.
Debug production like you're on localhost
Real-time log streaming
Stream logs from your entire application fleet through a unified interface. Search, filter, and debug production issues across all instances instantly.
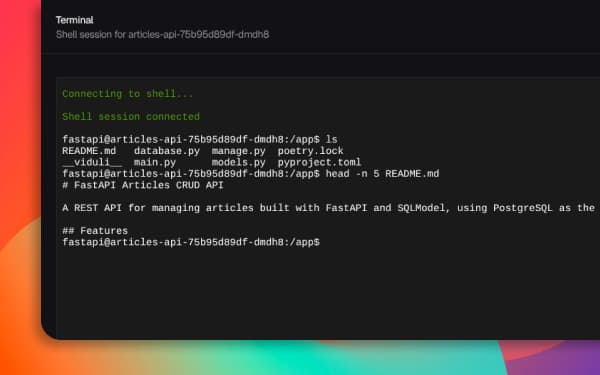
Shell access integration
Access logs and shell in one place. Debug issues with both log history and live shell access to any instance.
Multi-instance view
Track logs across auto-scaled instances. See which instance generated each log line. Perfect for distributed systems debugging.

Traditional log stacks vs. Viduli
Every debugging scenario
Fix issues in real-time
Stream logs as your application runs. Search for errors, trace request flows, identify performance bottlenecks.
- ✓Real-time error detection
- ✓Request tracing across services
- ✓Performance monitoring
Debug microservices effortlessly
View logs from multiple services simultaneously. Trace requests across service boundaries with unified timestamps.
- ✓Unified multi-service view
- ✓Cross-service request tracing
- ✓Distributed system insights
Share debugging context
Export log snippets with exact timestamps. Share specific error occurrences with team members or support.
- ✓Shareable log views
- ✓Exact timestamp references
- ✓Team debugging sessions
Enterprise-grade logging infrastructure
Retention & Storage
Performance
Features
Integration
Debug production with confidence
Join developers who've ditched complex log stacks for instant, hassle-free logging.